Single Beam Echo Sounding
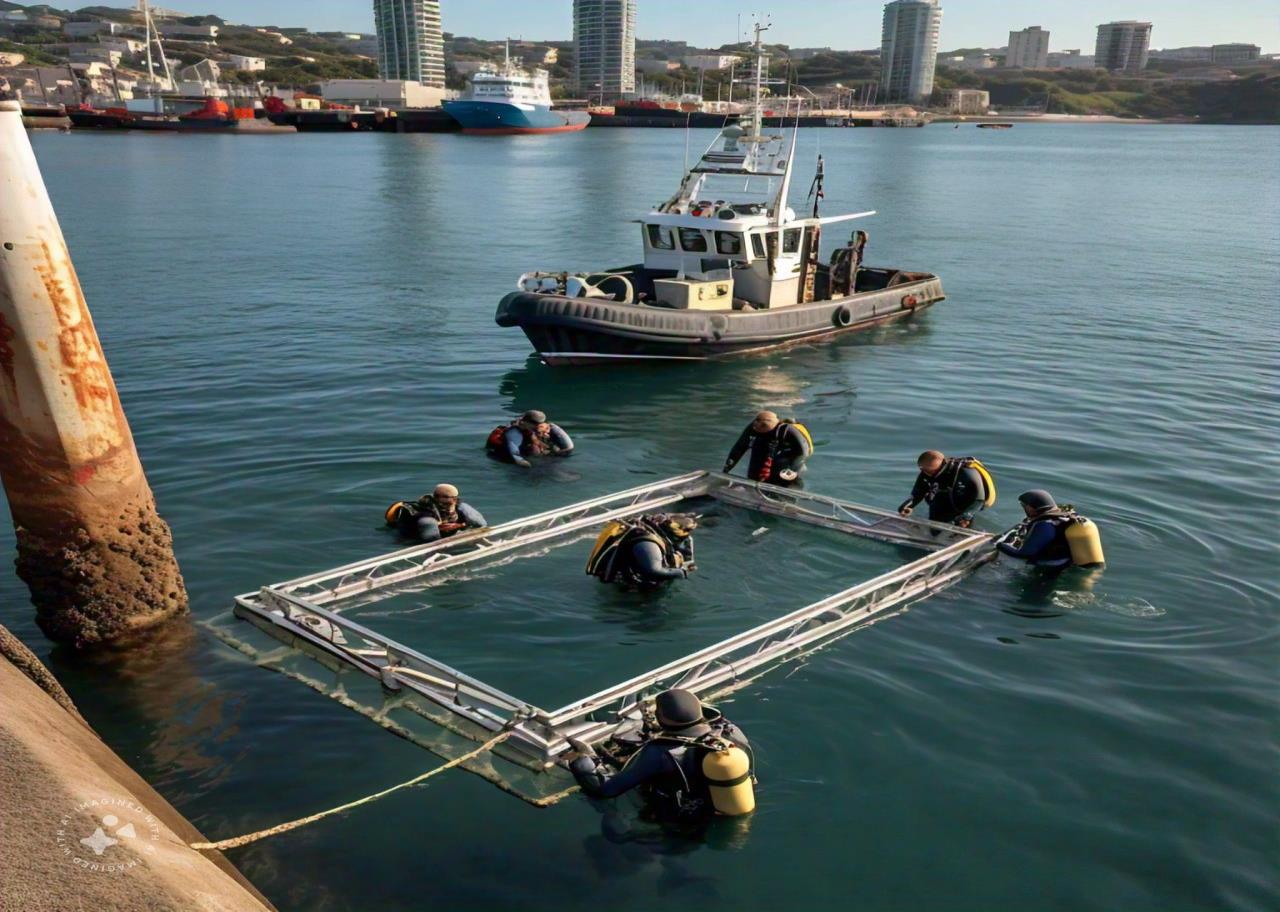
Single beam echo sounding measures water depth directly beneath a survey vessel. A transducer mounted on the hull or on an over-side pole sends a short acoustic pulse straight down and times its echo from the seabed. Using the measured speed of sound in the water, the echo sounder converts that time into depth. Dual-frequency systems can show both the top of soft mud and firmer material below. Each depth is tagged with a GNSS position and corrected for tide, vessel motion and draught. The resulting profiles are used for channel and harbour surveys, dredging quantity checks and nearshore engineering design.
Multi-Beam Bathymetric Surveys
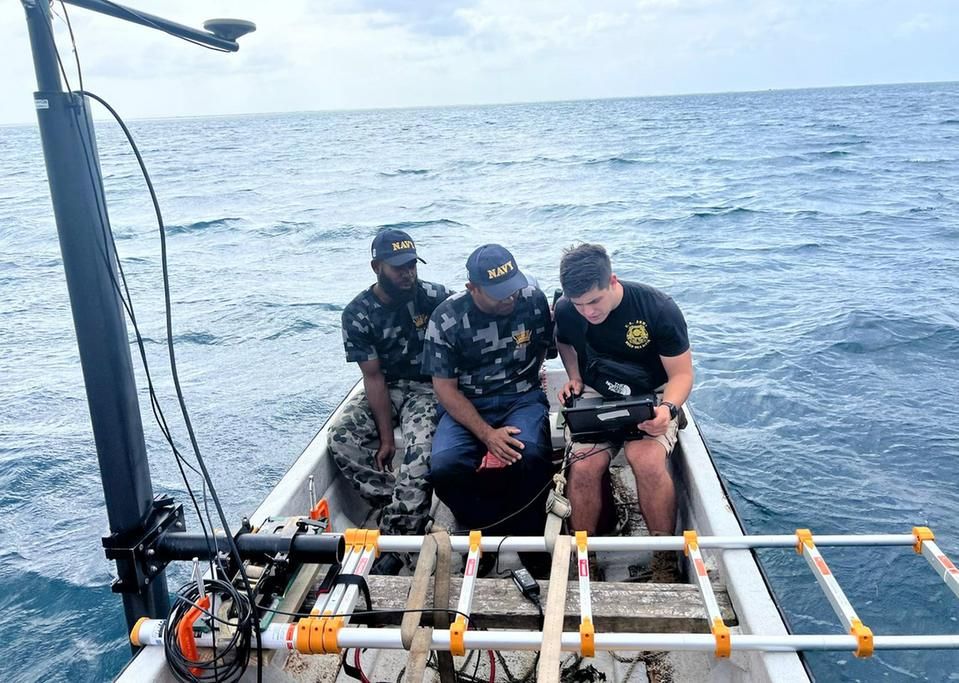
A multibeam bathymetric survey maps the seabed as a continuous strip, or swath, rather than a single line of depths. A multibeam echosounder fixed beneath the vessel transmits a fan of sound and forms hundreds of receive beams across the track, measuring many depths with every ping. A motion sensor, a heading reference, precise GNSS and sound-velocity profiles are used to correct each sounding. Processed data produces dense 3D surface models of the seabed that can meet IHO S-44 accuracy orders. Engineers use them for port and channel design, dredging control, pipeline and cable routes, and inspection of marine structures and scour.
Sub-Bottom Marine Surveys
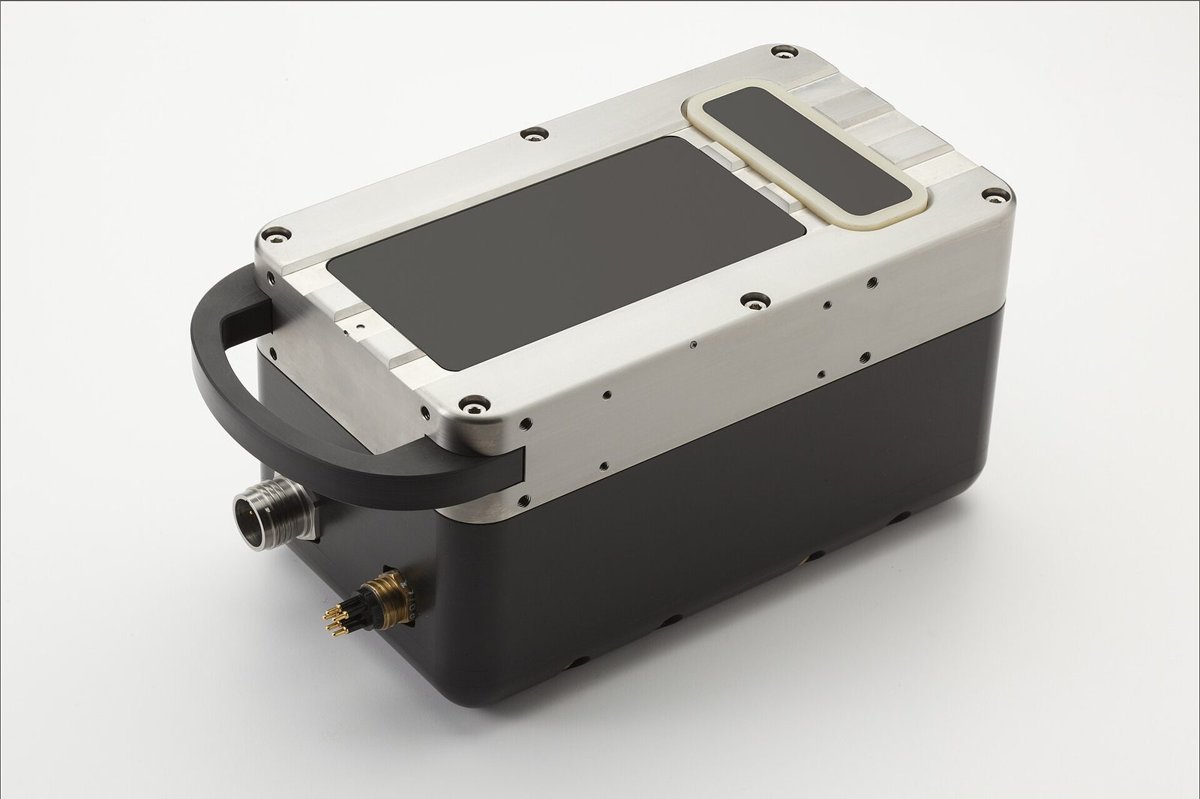
A sub-bottom survey looks beneath the seabed to reveal the layers of sediment and rock below. A sub-bottom profiler, either hull-mounted or towed behind the vessel, emits low-frequency acoustic pulses (chirp, pinger, boomer or sparker sources) that penetrate the seabed and reflect from boundaries between materials of different density. The reflections are recorded as continuous cross-sections, which geophysicists interpret to map sediment thickness, buried channels, rockhead, gas pockets and buried objects. The results guide dredgeability assessments, pipeline and cable burial, foundation design for offshore structures, and the placement of geotechnical boreholes.
Tidal Data Analysis
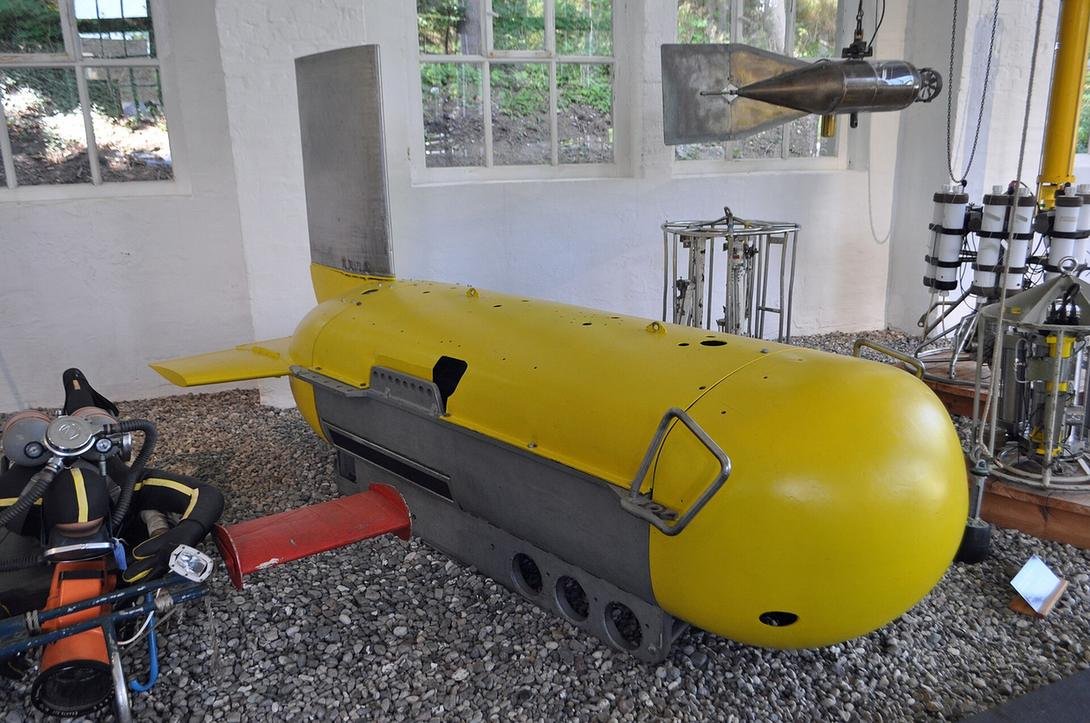
Tidal data analysis turns water-level records into reliable tide information for a site. Tide gauges, such as pressure sensors, radar gauges or stilling-well floats, record water levels at fixed intervals over weeks to years. Analysts check and clean the record, then apply harmonic analysis to separate the astronomical tide into its constituents and to identify non-tidal effects such as storm surge. The results define datums such as Chart Datum, Mean Sea Level and Highest and Lowest Astronomical Tide, and provide predictions and tidal reductions for soundings. Engineers rely on these values to set design levels for quays, breakwaters, outfalls and coastal developments.
Oceanographic & Bathymetric Data
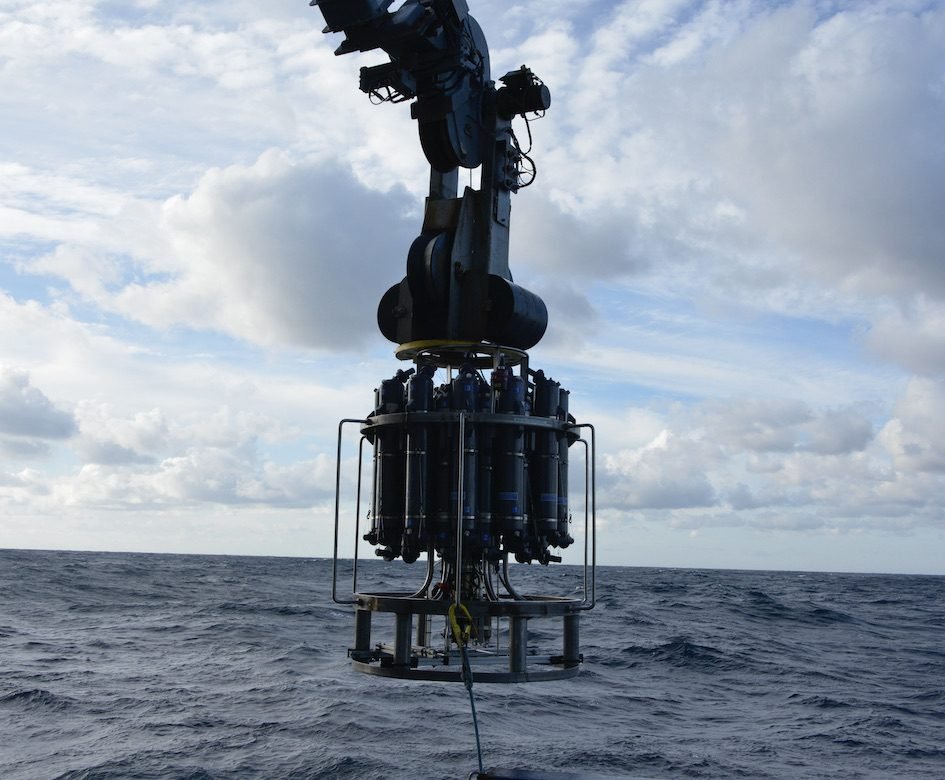
Oceanographic and bathymetric data describes both the shape of the seabed and the properties of the water above it. Bathymetry comes from single-beam and multibeam echo sounders. Oceanographic measurements come from instruments such as CTD profilers, which record conductivity (salinity), temperature and depth; sound-velocity probes; acoustic Doppler current profilers (ADCPs); and water samplers lowered from the vessel on a winch. Together these datasets give water depth, current speed and direction, water density, temperature layering and water quality. They are used to correct hydrographic surveys, model coastal processes, and design outfalls, intakes, marine structures and dredging works.
Met Ocean Observations
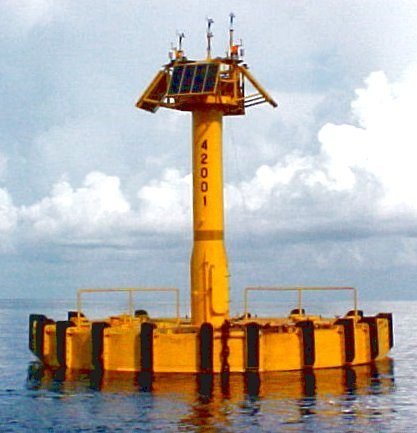
Met-ocean (meteorological and oceanographic) observations measure the wind, wave, current, water-level and weather conditions at a coastal or offshore site. Data is typically collected by moored buoys carrying anemometers, wave sensors and current meters, by seabed-mounted acoustic wave and current profilers, and by shore-based weather stations, often transmitting in near real time. Long records are analysed statistically to describe normal operating conditions and extreme events, such as the design wave height or wind speed for a given return period. Engineers use these criteria to design ports, breakwaters, offshore platforms and pipelines, and to plan safe weather windows for marine construction.
Other capabilities in this service
Back to Survey ServicesDiscuss your project with ATLAS GES
Tell us about your site and requirements, and our team will get back to you.
Get in Touch